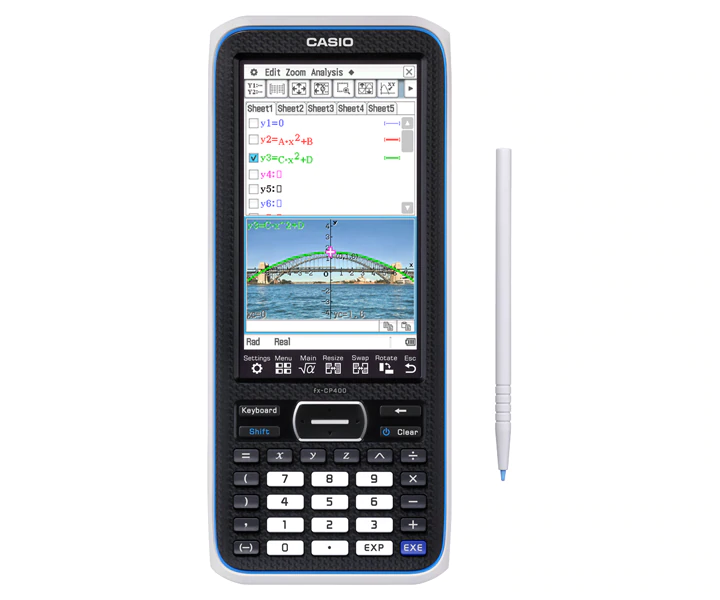
FXCP400
شامل الضريبة.
تفاصيل
سمات
يأتي مع غطاء صلب قابل للتركيب، وشاشة ملونة زاهية ولوحة لمس لسهولة استخدام فائقة.
عرض الشاشة الأفقي: عرض الصيغ الطويلة على سطر واحد.
شاشة ملونة رائعة مقاس 4.8 بوصة
الصيغ والرسوم البيانية وغيرها من الرسومات واضحة ودقيقة.
تتميز الشاشة بدقة 320 × 528 بكسل (أكثر من 65000 لون)، أي أعلى بمقدار 4.4 مرة من ClassPad 330 PLUS.
التشغيل باللمس باستخدام القلم - إنشاء الرسوم البيانية بسرعة وسهولة باستخدام السحب والإفلات.
واجهة بسيطة
يتميز جهاز fx-CP400 بأيقونات قوائم بسيطة وسهلة الفهم، وأشرطة قوائم، وأشرطة أدوات، وواجهة تفاعلية.
تشغيل لوحة اللمس بواسطة قلم أو إصبع
يوفر جهاز fx-CP400 تشغيلاً سهلاً باستخدام لوحة اللمس بالقلم، مما يلغي الحاجة إلى استخدام المفاتيح المعقدة. اعرض المعادلات الرياضية بيانياً ببساطة عن طريق سحبها وإفلاتها في منطقة الرسم البياني.
لوحة مفاتيح برمجية جديدة تمامًا
يدعم جهاز fx-CP400 تعلم الوظائف الأساسية التي يستخدمها الجميع، مثل الكسور والجذور التربيعية والدوال المثلثية، والوظائف المتقدمة مثل حساب التفاضل والتكامل والأعداد المركبة المعقدة وحسابات سيجما، بالإضافة إلى الحسابات المتقدمة للغاية مثل الصيغ المجزأة والصيغ التي يحددها المستخدم.
يدعم نظام الجبر الحاسوبي كل شيء بدءًا من التوسيع والتحليل والحل والأوامر الأساسية الأخرى وحتى الأوامر المتقدمة مثل تحويلات فورييه ولابلاس.
تطبيق النشاط الإلكتروني
النشاط الإلكتروني (eActivity) أشبه بورقة عمل رقمية يمكن إنشاؤها والعمل عليها على جهاز fx-CP400. يُمكن دمج جميع الميزات والإمكانيات القوية لجهاز fx-CP400 في النشاط الإلكتروني. إضافةً إلى إجراء نفس العمليات الحسابية التي يُجريها التطبيق الرئيسي، يقبل النشاط الإلكتروني إدخال النصوص، تمامًا مثل معالج النصوص. كما يُمكن تخزين الرسوم البيانية، بالإضافة إلى بيانات الهندسة وجداول البيانات، في ملف النشاط الإلكتروني.
رسم بياني وصورة
تأتي الآلة الحاسبة مُحمّلة مسبقًا برسومات توضيحية، مثل صورة ثابتة لمنحنى جسر مقوس. إن استخدام صور واقعية كخلفيات لوظائف مثل رسم الرسوم البيانية فوق الصور الملونة يجعل تعلم الرياضيات تجربةً أكثر جاذبيةً بصريًا. ملفات C2P - صور فردية
تم تحميل أكثر من 40 صورة مسبقًا على جهاز fx-CP400!
دالة الرسم البياني
يعرض الجهاز الصيغ والرسوم البيانية المرتبطة بها بنفس اللون، ويُبرز خصائص الرسم البياني من خلال عرض علامات المقياس والشبكات وقيم الإحداثيات. كما تُحسّن شاشة العرض الملونة الزاهية لجهاز fx-CP400 من وضوح الرسوم البيانية والصيغ.
يستطيع طلاب الهندسة تعلم النظريات العامة من خلال رسم الأشكال. يؤدي سحب وإفلات شكل هندسي في نافذة التطبيق الرئيسية إلى عرض البيانات الرقمية الخاصة به. كما تتيح وظيفة الرسوم المتحركة للطلاب تحريك الأشكال الهندسية المرسومة على الشاشة. يدعم جهاز fx-CP400 رسم القطوع المخروطية باستخدام التركيز.
يمكن تنظيم البيانات المجمعة وجدولتها لتحليلها بعد اكتمال الرسوم البيانية الإحصائية. كما يمكن استخدام بيانات الجداول في حسابات الجداول. بالإضافة إلى ذلك، يدعم جهاز fx-CP400 الوظائف التالية: البحث، والفرز، واستيراد البيانات وتصديرها من وإلى القوائم والمصفوفات والمتغيرات، ودالة CellIf، ورسم المخططات البيانية (الهيستوغرام/المخطط الصندوقي).
رابط اللون
يتميز جهاز fx-CP400 بوظيفة Color Link، التي تربط تلقائيًا الألوان المحددة على شاشة جدول البيانات بالألوان المستخدمة في الرسوم البيانية لدعم تعلم الوظائف من خلال تمكين التأكيد المرئي للتغييرات في القيم أو الاتجاهات.
تطبيق رسم بياني للمعادلات التفاضلية
يمكن تمثيل مجموعة حلول المعادلة التفاضلية بيانيًا كحقل متجهي، ويمكن رسم منحنيات الحل بتوفير الشروط الابتدائية للمعادلة. يدعم البرنامج المعادلات التفاضلية من الرتبة الأولى والثانية والرتبة n. تطبيقات مالية
يوفر تطبيق fx-CP400 هذا ما مجموعه 15 عملية حسابية مالية مختلفة، بما في ذلك الفائدة البسيطة/المركبة، والتدفق النقدي، والإطفاء، والاستهلاك، وحساب السندات، والرافعة التشغيلية/المالية.
الجبر
نظام الجبر الحاسوبي (CAS)
مساعد الجبر
الكسور
التحويل (التبسيط، التوسيع، التحليل)
تمثيل الدوال بيانيًا، والمعادلات القطبية، والمعادلات البارامترية، والمعادلات x = f (y).
التقييم العددي للدوال في الجداول
حل الرسم البياني (الجذر، القيمة القصوى، التقاطع، نقطة الانعطاف، المسافة)
الرسوم البيانية للقطوع المخروطية (القطع المكافئ، الدائرة، القطع الناقص، القطع الزائد، الشكل العام)
حل رسم بياني للقطوع المخروطية (البؤرة، الرأس، الدليل، التناظر، المركز، نصف القطر)
الجداول والرسوم البيانية العددية المتسلسلة المتكررة والصريحة
نظام العد (الأساس 2 (ثنائي)، 8 (ثماني)، 10 (عشري) و16 (سداسي عشري))
تحويل لابلاس، تحويل فورييه، تحويل فورييه السريع (FFT)
حساب التفاضل والتكامل
الهيبربولية
التكامل، التفاضل
معادلة تفاضلية
Σ, ∏, lim
دالة ديراك دلتا، خطوة وحدة هيفسايد، جاما
إحصائيات
الرسوم البيانية الإحصائية (مخطط التشتت، مخطط خط س ص، مخطط الاحتمالية الطبيعية، المدرج التكراري، مخطط الصندوق والشارب) رسوم بيانية للانحدار الإحصائي
الهندسة
تطبيق النشاط الإلكتروني
الأجهزة
نقل البيانات (عبر كابلات USB وكابلات ثلاثية الأطراف)
كابل USB للتوصيل بالكمبيوتر
كابل ثلاثي الأطراف للتوصيل بوحدة ClassPad أخرى أو EA-200
ميزات أخرى مفيدة
دالة الرسم البياني
السحب والإفلات
إدخال المعادلات والتعبيرات بصيغة طبيعية
عرض النتائج بتنسيق طبيعي
الرياضيات، الأبجدية، لوحات المفاتيح البرمجية ثنائية الأبعاد
لوحة مفاتيح برمجية لكتالوج الأوامر
تكوين مفتاح Shift
سجل الحسابات
الجزء العشري + الأس: 10 + 3
التلاعب التفاعلي لحل المعادلات
رسوم بيانية للمعادلات التفاضلية
حل المعادلات العددية
الحسابات المالية
قوائم الأيقونات
عرض الشاشة الكاملة / عرض الشاشة المنقسمة
إمكانية ترقية البرامج (الصيانة، ترقيات الميزات)
متغير مُعرَّف من قِبل المستخدم
دالة معرفة من قبل المستخدم (تمتد من الدوال المدمجة)
إدارة الذاكرة القائمة على المجلدات
إعادة ضبط/تهيئة الذاكرة
لغة عرض قابلة للتحديد
إيقاف التشغيل التلقائي (APO)
برنامج استقبال الشاشة المرفق
شاشة النهاية / شاشة النهاية التي يحددها المستخدم
رسم بياني وصورة
عرض الشاشة الأفقي
وحدة الطول
خيارات
مدير ClassPad (FA-CP400A/B)
محلل البيانات EA-200
اتصال مباشر عبر منفذ USB بجهاز عرض البيانات من كاسيو ∗
مزيد من المعلومات
حدِّد الخيارات